Home Blog Page 74

Patagonian Plankton Swirls

0

Phytoplankton create rich blooms of color in the Atlantic Ocean near South America in this enhanced color image from Dec. 2, 2014. The Patagonian Shelf Break is a biologically rich patch of ocean where airborne dust from the land, iron-rich currents from the south, and upwelling currents from the depths provide a bounty of nutrients for phytoplankton. The bands of color seen here not only reveal the location of plankton, but also the dynamic eddies and currents that carry them.

Image Credit: NASA/Norman Kuring; NOAA; DOD

By Monika Luabeya
Source NASA

‘Taffy Galaxies’ Collide And Leave Behind A Bridge Of Star-forming Material

0
The Gemini North telescope, one half of the International Gemini Observatory, operated by NSF’s NOIRLab, captured this dazzling image of the so-called Taffy Galaxies — . Their twisted appearance is the result of a head-on collision that occurred about 25 million years prior to their appearance in this image. A bridge of highly turbulent gas devoid of significant star formation spans the gap between the two galaxies. Credit: International Gemini Observatory/NOIRLab/NSF/AURA

Galaxy collisions are transformative events, largely responsible for driving the evolution of the Universe.

The mixing and mingling of stellar material is an incredibly dynamic process that can lead to the formation of molecular clouds populated with newly forming stars. But, a head-on collision between the two galaxies UGC 12914 (left) and UGC 12915 (right) 25–30 million years ago appears to have resulted in a different kind of structure — a bridge of highly turbulent material spanning the two galaxies. Though this intergalactic bridge is teeming with star-forming material, its turbulent nature is suppressing star formation.

This pair of galaxies, nicknamed the Taffy Galaxies, is located about 180 million light-years away in the direction of the constellation Pegasus.

This new image, captured with Gemini North [1], one half of the International Gemini Observatory, operated by NSF’s NOIRLab, showcases the fascinating feature that gave them their name. A tenuous bridge composed of narrow molecular filaments, shown in brown, and clumps of hydrogen gas, shown in red, can be seen between the two galaxies. Its complex web structure resembles taffy being stretched as the pair slowly separates.

Galaxy collisions can happen out of a variety of different scenarios, often involving a larger galaxy and a smaller satellite galaxy. As they drift near one another, the satellite galaxy can attract one of the larger galaxy’s primary spiral arms, pulling it out of its orbit. Or the satellite galaxy can actually intersect with the larger galaxy, causing significant distortions to its own structure. In other cases, a collision can lead to a merger if neither member has enough momentum to continue on after colliding. In all these scenarios, stellar material from both galaxies mixes through a gradual combining and redistribution of gas, like two puddles of liquid that are slowly bleeding into each other. The resulting collecting and compression of the gas can then trigger star formation.

A head-on collision, however, would be more like pouring liquid from two separate cups into a shared bowl. When the Taffy Galaxies’ collided, their galactic disks and gaseous components smashed right into each other. This resulted in a massive injection of energy into the gas, causing it to become highly turbulent. As the pair emerged from their collision, high-velocity gas was pulled from each galaxy, creating a massive gas bridge between them. The turbulence of the stellar material throughout the bridge is now prohibiting the collection and compression of gas that are required to form new stars.

The Gemini North observations of this object were led by Analía Smith Castelli, an astronomer with the Instituto de Astrofísica de La Plata in Argentina. Argentina is one of the partners in the International Gemini Observatory.

Notes

[1] The data for this image were acquired before the Gemini North primary mirror was taken offline for repairs. https://noirlab.edu/public/announcements/ann22030/

More information

NSF’s NOIRLab (National Optical-Infrared Astronomy Research Laboratory), the US center for ground-based optical-infrared astronomy, operates the International Gemini Observatory (a facility of NSF, NRC–Canada, ANID–Chile, MCTIC–Brazil, MINCyT–Argentina, and KASI–Republic of Korea), Kitt Peak National Observatory (KPNO), Cerro Tololo Inter-American Observatory (CTIO), the Community Science and Data Center (CSDC), and Vera C. Rubin Observatory (in cooperation with DOE’s SLAC National Accelerator Laboratory). It is managed by the Association of Universities for Research in Astronomy (AURA) under a cooperative agreement with NSF and is headquartered in Tucson, Arizona. The astronomical community is honored to have the opportunity to conduct astronomical research on Iolkam Du’ag (Kitt Peak) in Arizona, on Maunakea in Hawai‘i, and on Cerro Tololo and Cerro Pachón in Chile. We recognize and acknowledge the very significant cultural role and reverence that these sites have to the Tohono O’odham Nation, to the Native Hawaiian community, and to the local communities in Chile, respectively.

By Keith Cowing
Source SpaceRef

NASA’s Perseverance Collects First Mars Sample of New Science Campaign

0
This image shows the rocky outcrop the Perseverance science team calls “Berea” after the NASA Mars rover extracted a rock core (right) and abraded a circular patch (left). The image was taken by one of the rover’s front hazard cameras on March 30, 2023, the 749th Martian day, or sol, of the mission. Credit: NASA/JPL-Caltech Full Image Details

The rover continues its hunt for rocks worthy of bringing to Earth for further study.

NASA’s Perseverance rover cored and stored the first sample of the mission’s newest science campaign on Thursday, March 30. With each campaign, the team explores and studies a new area. On this one, the rover is exploring the top of Jezero Crater’s delta. Perseverance has collected a total of 19 samples and three witness tubes, and it recently deposited 10 tubes as a backup cache on the Martian surface as part of the NASA-ESA (European Space Agency) Mars Sample Return campaign.

Scientists want to study Martian samples with powerful lab equipment on Earth to search for signs of ancient microbial life and to better understand the water cycle that has shaped the surface and interior of Mars.

This animation shows NASA’s Perseverance Mars rover collecting a rock sample from an outcrop the science team calls “Berea” using a coring bit on the end of its robotic arm. The images were taken by one of the rover’s front hazard cameras.
Credit: NASA/JPL-Caltech

Cored from a rock the science team calls “Berea,” this latest sample is the 16th cored rock sample of the mission (there are also samples of regolith – or broken rock and dust – as well as Mars atmosphere; read more about the samples). The science team believes Berea formed from rock deposits that were carried downstream by an ancient river to this location. That would mean the material could have come from an area well beyond the confines of Jezero Crater, and it’s one reason why the team finds the rock so promising.

“The second reason is that the rock is rich in carbonate,” said Katie Stack Morgan, deputy project scientist for Perseverance at NASA’s Jet Propulsion Laboratory in Southern California. “Carbonate rocks on Earth can be good at preserving fossilized lifeforms. If biosignatures were present in this part of Jezero Crater, it could be a rock like this one that could very well hold their secrets.”

A Climate Puzzle

One big puzzle is how Mars’ climate worked back when this area was covered with liquid water. Because carbonates form due to chemical interactions in liquid water, they can provide scientists a long-term record of changes in the planet’s climate. By studying the carbonate in the Berea sample, the science team could help fill in the gaps.

“The Berea core highlights the beauty of rover missions,” said Perseverance’s project scientist, Ken Farley of Caltech in Pasadena. “Perseverance’s mobility has allowed us to collect igneous samples from the relatively flat crater floor during the first campaign, and then travel to the base of the crater’s delta, where we found fine-grained sedimentary rocks deposited in a dried lakebed. Now we are sampling from a geologic location where we find coarse-grained sedimentary rocks deposited in a river. With this diversity of environments to observe and collect from, we are confident that these samples will allow us to better understand what occurred here at Jezero Crater billions of years ago.”

This image shows the rock core from “Berea” inside inside the drill of NASA’s Perseverance Mars rover. Each core the rover takes is about the size of a piece of classroom chalk: 0.5 inches (13 millimeters) in diameter and 2.4 inches (60 millimeters) long.
Credit: NASA/JPL-Caltech/ASU/MSSS 
Full Image Details

With this latest sample stored safely in a sample tube in the rover’s belly, the six-wheeler will continue to climb Jezero’s sedimentary fan toward the next bend in the dry riverbed, a location the science team is calling “Castell Henllys.”

More About the Mission

A key objective for Perseverance’s mission on Mars is astrobiology, including caching samples that may contain signs of ancient microbial life. The rover will characterize the planet’s geology and past climate, pave the way for human exploration of the Red Planet, and be the first mission to collect and cache Martian rock and regolith.

Subsequent NASA missions, in cooperation with ESA, would send spacecraft to Mars to collect these sealed samples from the surface and return them to Earth for in-depth analysis.

The Mars 2020 Perseverance mission is part of NASA’s Moon to Mars exploration approach, which includes Artemis missions to the Moon that will help prepare for human exploration of the Red Planet.

JPL, which is managed for NASA by Caltech, built and manages operations of the Perseverance rover.

More highlights of Perseverance’s first two years on Mars:

https://mars.nasa.gov/mars2020/mission/highlights/

For more about Perseverance:

https://mars.nasa.gov/mars2020/

News Media Contact

DC Agle
Jet Propulsion Laboratory, Pasadena, Calif.
818-393-9011
[email protected]

Karen Fox / Alana Johnson
NASA Headquarters, Washington
301-286-6284 / 202-358-1501
[email protected] / [email protected]

NASA’s Webb Measures The Temperature Of A Rocky Exoplanet

0

Summary

The amount of infrared light coming from TRAPPIST-1 b suggests that the planet is devoid of any significant atmosphere.  

Acting as a giant touch-free thermometer, NASA’s James Webb Space Telescope has successfully measured heat radiating from the innermost of the seven rocky planets orbiting TRAPPIST-1, a cool red dwarf star 40 light-years from Earth. With a dayside temperature of 450 degrees Fahrenheit, the planet is just about perfect for baking pizza. But with no atmosphere to speak of, it may not be the best spot to dine out. The result is the first from a comprehensive set of Webb studies of the TRAPPIST-1 system, and marks an important step in determining whether planets orbiting tiny but violent red dwarfs, the most common type of star in the Galaxy, can sustain atmospheres needed to support life.

Rocky Exoplanet TRAPPIST-1 b (Illustration)

Full Article

An international team of researchers has used NASA’s James Webb Space Telescope to measure the temperature of the rocky exoplanet TRAPPIST-1 b. The measurement is based on the planet’s thermal emission: heat energy given off in the form of infrared light detected by Webb’s Mid-Infrared Instrument (MIRI). The result indicates that the planet’s dayside has a temperature of about 500 kelvins (roughly 450 degrees Fahrenheit) and suggests that it has no significant atmosphere. 

This is the first detection of any form of light emitted by an exoplanet as small and as cool as the rocky planets in our own solar system. The result marks an important step in determining whether planets orbiting small active stars like TRAPPIST-1 can sustain atmospheres needed to support life. It also bodes well for Webb’s ability to characterize temperate, Earth-sized exoplanets using MIRI. 

“These observations really take advantage of Webb’s mid-infrared capability,” said Thomas Greene, an astrophysicist at NASA’s Ames Research Center and lead author on the study published today in the journal Nature. “No previous telescopes have had the sensitivity to measure such dim mid-infrared light.” 

Rocky Planets Orbiting Ultracool Red Dwarfs

In early 2017, astronomers reported the discovery of seven rocky planets orbiting an ultracool red dwarf star (or M dwarf) 40 light-years from Earth. What is remarkable about the planets is their similarity in size and mass to the inner, rocky planets of our own solar system. Although they all orbit much closer to their star than any of our planets orbit the Sun — all could fit comfortably within the orbit of Mercury — they receive comparable amounts of energy from their tiny star. 

TRAPPIST-1 b, the innermost planet, has an orbital distance about one hundredth that of Earth’s and receives about four times the amount of energy that Earth gets from the Sun. Although it is not within the system’s habitable zone, observations of the planet can provide important information about its sibling planets, as well as those of other M-dwarf systems.  

“There are ten times as many of these stars in the Milky Way as there are stars like the Sun, and they are twice as likely to have rocky planets as stars like the Sun,” explained Greene. “But they are also very active — they are very bright when they’re young, and they give off flares and X-rays that can wipe out an atmosphere.”

Co-author Elsa Ducrot from the French Alternative Energies and Atomic Energy Commission (CEA) in France, who was on the team that conducted earlier studies of the TRAPPIST-1 system, added, “It’s easier to characterize terrestrial planets around smaller, cooler stars. If we want to understand habitability around M stars, the TRAPPIST-1 system is a great laboratory. These are the best targets we have for looking at the atmospheres of rocky planets.”

Detecting an Atmosphere (or Not) 

Previous observations of TRAPPIST-1 b with the Hubble and Spitzer space telescopes found no evidence for a puffy atmosphere, but were not able to rule out a dense one. 

One way to reduce the uncertainty is to measure the planet’s temperature. “This planet is tidally locked, with one side facing the star at all times and the other in permanent darkness,” said Pierre-Olivier Lagage from CEA, a co-author on the paper. “If it has an atmosphere to circulate and redistribute the heat, the dayside will be cooler than if there is no atmosphere.” 

The team used a technique called secondary eclipse photometry, in which MIRI measured the change in brightness from the system as the planet moved behind the star. Although TRAPPIST-1 b is not hot enough to give off its own visible light, it does have an infrared glow. By subtracting the brightness of the star on its own (during the secondary eclipse) from the brightness of the star and planet combined, they were able to successfully calculate how much infrared light is being given off by the planet.

Measuring Minuscule Changes in Brightness

Webb’s detection of a secondary eclipse is itself a major milestone. With the star more than 1,000 times brighter than the planet, the change in brightness is less than 0.1%. 

“There was also some fear that we’d miss the eclipse. The planets all tug on each other, so the orbits are not perfect,” said Taylor Bell, the post-doctoral researcher at the Bay Area Environmental Research Institute who analyzed the data. “But it was just amazing: The time of the eclipse that we saw in the data matched the predicted time within a couple of minutes.” 

The team analyzed data from five separate secondary eclipse observations. “We compared the results to computer models showing what the temperature should be in different scenarios,” explained Ducrot. “The results are almost perfectly consistent with a blackbody made of bare rock and no atmosphere to circulate the heat. We also didn’t see any signs of light being absorbed by carbon dioxide, which would be apparent in these measurements.”

This research was conducted as part of Webb Guaranteed Time Observation (GTO) program 1177, which is one of eight programs from Webb’s first year of science designed to help fully characterize the TRAPPIST-1 system. Additional secondary eclipse observations of TRAPPIST-1 b are currently in progress, and now that they know how good the data can be, the team hopes to eventually capture a full phase curve showing the change in brightness over the entire orbit. This will allow them to see how the temperature changes from the day to the nightside and confirm if the planet has an atmosphere or not. 

“There was one target that I dreamed of having,” said Lagage, who worked on the development of the MIRI instrument for more than two decades. “And it was this one. This is the first time we can detect the emission from a rocky, temperate planet. It’s a really important step in the story of discovering exoplanets.”

The James Webb Space Telescope is the world’s premier space science observatory. Webb will solve mysteries in our solar system, look beyond to distant worlds around other stars, and probe the mysterious structures and origins of our universe and our place in it. Webb is an international program led by NASA with its partners, ESA (European Space Agency), and CSA (Canadian Space Agency). MIRI was contributed by NASA and ESA, with the instrument designed and built by a consortium of nationally funded European Institutes (the MIRI European Consortium) and NASA’s Jet Propulsion Laboratory, in partnership with the University of Arizona.

About This Release

Credits

MEDIA CONTACT:

Margaret W. Carruthers
Space Telescope Science Institute, Baltimore, Maryland

Christine Pulliam
Space Telescope Science Institute, Baltimore, Maryland

Permissions

Content Use Policy

Keywords

Contact Us

Direct inquiries to the News Team.

Related Links and Documents

Originally published at Webb Space Telescope

An AI Algorithm Unblurs The Cosmos

0
Unblurred image via AI. Northwestern University

The cosmos would look a lot better if Earth’s atmosphere wasn’t photo bombing it all the time.

Even images obtained by the world’s best ground-based telescopes are blurry due to the atmosphere’s shifting pockets of air. While seemingly harmless, this blur obscures the shapes of objects in astronomical images, sometimes leading to error-filled physical measurements that are essential for understanding the nature of our universe.

Now researchers at Northwestern University and Tsinghua University in Beijing have unveiled a new strategy to fix this issue. The team adapted a well-known computer-vision algorithm used for sharpening photos and, for the first time, applied it to astronomical images from ground-based telescopes. The researchers also trained the artificial intelligence (AI) algorithm on data simulated to match the Vera C. Rubin Observatory’s imaging parameters, so, when the observatory opens next year, the tool will be instantly compatible.

While astrophysicists already use technologies to remove blur, the adapted AI-driven algorithm works faster and produces more realistic images than current technologies. The resulting images are blur-free and truer to life. They also are beautiful — although that’s not the technology’s purpose.

“Photography’s goal is often to get a pretty, nice-looking image,” said Northwestern’s Emma Alexander, the study’s senior author. “But astronomical images are used for science. By cleaning up images in the right way, we can get more accurate data. The algorithm removes the atmosphere computationally, enabling physicists to obtain better scientific measurements. At the end of the day, the images do look better as well.”

The research will be published March 30 in the Monthly Notices of the Royal Astronomical Society.

Alexander is an assistant professor of computer science at Northwestern’s McCormick School of Engineering, where she runs the Bio Inspired Vision Lab. She co-led the new study with Tianao Li, an undergraduate in electrical engineering at Tsinghua University and a research intern in Alexander’s lab.

When light emanates from distant stars, planets and galaxies, it travels through Earth’s atmosphere before it hits our eyes. Not only does our atmosphere block out certain wavelengths of light, it also distorts the light that reaches Earth. Even clear night skies still contain moving air that affects light passing through it. That’s why stars twinkle and why the best ground-based telescopes are located at high altitudes where the atmosphere is thinnest.

“It’s a bit like looking up from the bottom of a swimming pool,” Alexander said. “The water pushes light around and distorts it. The atmosphere is, of course, much less dense, but it’s a similar concept.”

The blur becomes an issue when astrophysicists analyze images to extract cosmological data. By studying the apparent shapes of galaxies, scientists can detect the gravitational effects of large-scale cosmological structures, which bend light on its way to our planet. This can cause an elliptical galaxy to appear rounder or more stretched than it really is. But atmospheric blur smears the image in a way that warps the galaxy shape. Removing the blur enables scientists to collect accurate shape data.

“Slight differences in shape can tell us about gravity in the universe,” Alexander said. “These differences are already difficult to detect. If you look at an image from a ground-based telescope, a shape might be warped. It’s hard to know if that’s because of a gravitational effect or the atmosphere.”

To tackle this challenge, Alexander and Li combined an optimization algorithm with a deep-learning network trained on astronomical images. Among the training images, the team included simulated data that matches the Rubin Observatory’s expected imaging parameters. The resulting tool produced images with 38.6% less error compared to classic methods for removing blur and 7.4% less error compared to modern methods.

When the Rubin Observatory officially opens next year, its telescopes will begin a decade-long deep survey across an enormous portion of the night sky. Because the researchers trained the new tool on data specifically designed to simulate Rubin’s upcoming images, it will be able to help analyze the survey’s highly anticipated data.

For astronomers interested in using the tool, the open-source, user-friendly code and accompanying tutorials are available online.

“Now we pass off this tool, putting it into the hands of astronomy experts,” Alexander said. “We think this could be a valuable resource for sky surveys to obtain the most realistic data possible.”

The study, “Galaxy image deconvolution for weak gravitational lensing with unrolled plug-and-play ADMM,” used computational resources from the Computational Photography Lab at Northwestern University.

By Keith Cowing
Source SpaceRef

The Brightest Explosion Ever Seen

0
Artist’s illustration of a gamma-ray burst resulting from a collapsing stars, ejecting particles and radiation in a narrow jet. CREDIT Soheb Mandhai

Gamma-ray bursts are the most energetic and luminous events known to occur in the Universe. Short-lived flashes of gamma-rays that typically last from a a tenth of a second to less than an hour, gamma-ray bursts may for a brief period of time outshine entire galaxies. The explosions are believed to be caused by the collapse of massive stars, the collision of neutron stars, or the merging of a neutron star and a black hole.

Although we have known about their existence for 60 years, there is still much to learn about these fascinating events. Not only are they transient and occur at random locations in the sky; gamma-rays are also mostly absorbed by our atmosphere impeding their detection from Earth.

To detect them, scientists therefore use space-based gamma-ray telescopes that, when triggered, send automatic instant messages to Earth. This allows the astronomers to follow up the detections with Earth-based telescopes, to look for a less energetic “afterglow” that often follows the gamma-rays.

Outshining an entire galaxy

On 9 October 2022, ESA’s INTEGRAL, NASA’s Swift and Fermi satellites, and other space observatories detected the gamma-ray burst which was, accordingly, named GRB 221009A. This led Daniele Bjørn Malesani, astronomer at Radboud University in the Netherlands and affiliated scientist at the Cosmic Dawn Center, to point the Very Large Telescope (VLT) in Chile toward the direction of GRB 221009A.

Using the X-shooter spectrograph mounted at the VLT, the resulting spectrum allowed Malesani and his team to measure the exact distance to GRB 221009A. Although the host galaxy of the burst turned out to lie more than two billion lightyears away, this actually makes it one of the most nearby bursts. Moreover, with a secure distance the team were also able to calculate the total amount of energy released from the burst.

“Gamma-ray bursts are always energetic, but this one was absolutely astonishing: During the 290 seconds that it lasted, GRB 221009A released roughly 1,000 times as much energy as our Sun has emitted during all of its lifetime of 4,5 billion years,” says Malesani.

Another way to put it is that the burst for a brief period of time was more luminous that the combined light of all the hundreds of billions of stars in the Milky Way.

As is normal, this calculation assumes that GRB 221009A has emitted the same amount of energy in all directions. More likely though, the energy in “concentrated” in a narrow beam, in the direction of which we happen to lie. The total energy is therefore somewhat smaller, although still extremely high.

And in any rate, it is the most energetic gamma-ray burst ever detected, 70 times brighter than ever seen before. It was even reported to affect the Earth’s ionosphere.

“Theoretically, we would expect such a powerful event to happen only once in 10,000 years,” explains Malesani. “This makes us wonder if our detection is just sheer luck, of if there’s something we’re misunderstanding about the nature of gamma-ray bursts.”

Followed up with James Webb

GRB 221009A was also followed up at longer wavelengths with the James Webb Space Telescope. These observations were led by Andrew Levan, also at Radboud University, although Malesani and other DAWNers also were a part of the team.

These observation allowed the astronomers to further characterize the gamma-ray burst. The James Webb telescope was particularly useful because the burst happens to lie, by an unlucky chance, behind a thick layer of cosmic dust inside the Milky Way galaxy. This has nothing to do with the burst itself, but makes it harder to interpret the results, as it dims the light from the burst. Webb looked at the afterglow in the mid infrared, which is much less affected by dust, offering a better view of the event.

But even Webb has shortcomings

Kasper Heintz, assistant professor at the Cosmic Dawn Center, participated in both studies. He explains: “Gamma-ray bursts like GRB 221009A are expected to explode together with a supernova whose light should ‘add’ to the burst itself. But for this burst, despite Webb’s huge mirror it couldn’t find convincing evidence for a bright supernova.”

So, was the supernova just fainter than normal, or was it missing altogether? The jury is still out, and there are more surprises to come from this once-in-a-lifetime mysterious event.

The articles have just been accepted for publication in, respectively, Astronomy & Astrophysics and Astrophysical Journal Letters.

The First JWST Spectrum of a GRB Afterglow: No Bright Supernova in Observations of the Brightest GRB of all Time, GRB 221009A, The Astrophysical Journal Letters (open access)

By Keith Cowing
Source SpaceRef

Bright Gamma Ray Burst Confounds Models Of Black Hole Birth

0
The long gamma ray burst GRB 221009A was generated about 1.9 billion years ago, far beyond our Milky Way galaxy, as simulated here. It appeared in the constellation Sagitta, within the dust-rich central plane of our galaxy. The bright star at top left is Vega. The burst itself lasted about 300 seconds, but the afterglow as seen from Earth will be visible for decades. (Animation credit: NASA’s Goddard Space Flight Center)

Last October, following one of the brightest flashes of gamma rays ever observed in the sky, telescopes around the world captured a wealth of data from an event that is thought to herald the collapse of a massive star and the birth of a black hole.

But that fire hose of data demonstrated clearly that our understanding of how stars collapse and generate enormous jets of outflowing material accompanied by powerful blasts of X-rays and gamma rays — and likely lots of heavy elements — is woefully inadequate.

“The data are so good that, basically, the models failed — failed deeply,” said Raffaella Margutti, associate professor of astronomy and of physics at the University of California, Berkeley. “That makes sense because the models are not very complicated. Nature is saying, ‘Well, what you’re seeing is probably an outflow that has way more components than what you think it is.’”

Details of the many sets of observations by radio, optical, X-ray and gamma ray telescopes were presented today at a High Energy Astrophysics Division meeting of the American Astronomical Society in Waikoloa, Hawaii, and in papers published in The Astrophysical Journal Letters.

Margutti was among the astronomers who mobilized observatories around the world after the gamma ray burst was detected by two NASA satellites on Oct. 9, 2022. Called GRB 221009A, it lasted over 300 seconds, marking it as a “long-duration” gamma ray burst (GRB) and linking it to the collapse of the core of a massive star into a black hole — this one about 1.9 billion light years from Earth. Core collapse is thought to push material out the poles of the star in highly collimated jets at speeds close to the speed of light. If Earth is in the path of the jet, we see a burst of gamma rays.

“As the jets slam into gas surrounding the dying star, a bright afterglow of light is produced across the entire spectrum,” said Tanmoy Laskar, assistant professor of physics and astronomy at the University of Utah and lead author of the study accepted by ApJ Letters. “The afterglows of GRBs fade quite rapidly, which means we had to be quick and nimble in capturing the light before it disappeared, taking its secrets with it.”

Multi-messenger astronomy

Margutti, Laskar and colleagues quickly triggered observing programs on NASA’s NuSTAR satellite, as well as observations at a slew of other facilities, including the Giant Metrewave Radio Telescope (GMRT) in India, the MeerKAT Array in South Africa, the U.S. National Science Foundation’s Karl G. Jansky Very Large Array (VLA) in New Mexico (USA), the Atacama Large Millimeter Array (ALMA) in Chile, and the Submillimeter Array (SMA) in Hawaii. The multi-wavelength observations collected by the researchers now comprise one of the most detailed data sets for a GRB afterglow to date. While they think the burst is related to the explosion of a massive star, they have not yet found evidence of light from the supernova.

Gamma ray bursts are thought to result when a massive star collapses to a black hole (left), sending jets of high-speed material outward along its poles. As the material slams into dust and gas around the star, radiation is emitted across the spectrum by hot ionized gas (plasma) in the vicinity of the newborn black hole, collisions among shells of fast-moving gas within the jet (internal shock waves) and from the leading edge of the jet as it sweeps up and interacts with its surroundings (external shock). The afterglow can be visible for months or years. Telescopes on Earth and in space detected many of these different wavelengths of light from GRB 221009A, enabling a detailed analysis of the event. (Graphic credit: NASA Goddard Space Flight Center)

With the NuSTAR observations, the researchers measured the shape of the X-ray spectrum with exquisite precision, allowing an estimation of how particles are accelerated by the explosion’s shock wave and spiral around magnetic fields roiled by the explosion.

“NuSTAR observations were essential for this study because they helped us pin down the strength of the magnetic field in the afterglow,” Margutti said. Knowing the magnetic field strength is important, because without it, the true energy of the explosion cannot be easily estimated.

From their analysis, the astronomers found that the energy of the jet was typical of most GRBs, even though from Earth it appeared about 70 times brighter than any previous GRB.

“We think that what makes this GRB bright, more than a high intrinsic energy, is instead the particularly narrow angle into which that energy is channeled,” said Kate Alexander, assistant professor of astronomy at the University of Arizona and a co-author of the study.

Upon analyzing and combining the data from all these telescopes, they found that the radio measurements were brighter than expected based on the X-ray and visible light alone. This did not fit the signature of a reverse shock — a hypothesized situation in which a shock wave propagates backward through the jet and generates radio emissions — but indicated something more complicated happened as the jet punched through material surrounding the collapsing star.

“Either we don’t understand reverse shocks, or we’ve found a completely new emission component,” Laskar said.

“We think that there is still a very fast-moving jet that is generating the X-rays and visible light in this afterglow,” added Margutti. “But our modeling suggests that something else entirely is creating the radio light.”

The Hubble Space Telescope’s Wide Field Camera 3 revealed the infrared afterglow (circled) of the gamma ray burst and its host galaxy, seen nearly edge-on as a sliver of light extending to upper right from the burst. This composite incorporates images taken on Nov. 8 and Dec. 4, 2022, one and two months after the eruption. The picture combines three near-infrared images taken each day at wavelengths from 1 to 1.5 microns and is 2.2 arcminutes wide. (Image credit: NASA, ESA, CSA, STScI, A. Levan [Radboud University]. Image Processing: Gladys Kober)Observations of jets from colliding neutron stars, for example, show that jets are accompanied by turbulence around the narrow jet core that looks from a distance like a sheath of material.

“We know that jets launched by neutron star mergers develop wings of less collimated material around a very narrow core,” Margutti said. “It is natural to expect that a similar effect will happen to a jet that has to pierce through a significantly larger amount of material — for example, a massive star, as in the case of GRB 221009A. So, we do expect a jet with a very narrow core that dominates the high-energy emission, surrounded by a sheath of material.”

Whatever the cause, the data imply that a decades-old theory of GRB jets needs to be revisited, Laskar said.

Margutti emphasized that this stellar collapse has more to tell astronomers. The afterglow is still detectable and is likely to be visible for years. She and colleagues are planning observations with the James Webb Space Telescope, the Hubble Space Telescope and many ground-based telescopes to follow the changing light from GRB 221009A. And at some point, when the jets from the stellar explosion have traveled far enough from the black hole to be visible, they hope to get a picture of the jets using radio interferometers, such as the hemisphere-spanning Very Long Baseline Array.

RELATED INFORMATION

By: Robert Sanders (Media relations)
Originally published at Berkeley News

A Comprehensive Map Of The Volcanoes On Venus — All 85,000 Of Them

0
The Volcanoes On Venus — Washington University in St. Louis

Intrigued by reports of recent volcanic eruptions on Venus? WashU planetary scientists Paul Byrne and Rebecca Hahn want you to use their new map of 85,000 volcanoes on Venus to help locate the next active lava flow.

Their study was posted online ahead of print in JGR Planets.

“This paper provides the most comprehensive map of all volcanic edifices on Venus ever compiled,” said Byrne, an associate professor of earth and planetary sciences in Arts & Sciences at Washington University in St. Louis. “It provides researchers with an enormously valuable database for understanding volcanism on that planet — a key planetary process, but for Venus is something about which we know very little, even though it’s a world about the same size as our own.”

Byrne and Hahn used radar imagery from NASA’s Magellan mission to Venus to catalog volcanoes across Venus at a global scale. Their resulting database contains 85,000 volcanoes, about 99% of which are less than 3 miles (5 km) in diameter.

“Since NASA’s Magellan mission in the 1990s, we’ve had numerous major questions about Venus’ geology, including its volcanic characteristics,” Byrne said. “But with the recent discovery of active volcanism on Venus, understanding just where volcanoes are concentrated on the planet, how many there are, how big they are, etc., becomes all the more important — especially since we’ll have new data for Venus in the coming years.”

“We came up with this idea of putting together a global catalog because no one’s done it at this scale before,” said Hahn, a graduate student in earth and planetary sciences at Washington University, first author of the new paper. “It was tedious, but I had experience using ArcGIS software, which is what I used to build the map. That tool wasn’t available when these data first became available back in the ’90s.

“People back then were manually hand-drawing circles around the volcanoes, when I can just do it on my computer.”

“This new database will enable scientists to think about where else to search for evidence of recent geological activity,” said Byrne, who is a faculty fellow of the university’s McDonnell Center for the Space Sciences. “We can do it either by trawling through the decades-old Magellan data (as the new Science paper did) or by analyzing future data and comparing it with Magellan data.”

Byrne and Hahn’s new study includes detailed analyses of where volcanoes are, where and how they’re clustered, and how their spatial distributions compare with geophysical properties of the planet such as crustal thickness.

Taken together, this work provides the most comprehensive understanding of Venus’ volcanic properties — and perhaps of any world’s volcanism so far.

That’s because, although we know a great deal about the volcanoes on Earth that are on land, there are still likely a great many yet to be discovered under the oceans. Lacking oceans of its own, Venus’ entire surface can be viewed with Magellan radar imagery.

Although there are volcanoes across almost the entire surface of Venus, the scientists found relatively fewer volcanoes in the 20-100 km diameter range, which may be a function of magma availability and eruption rate, they surmise.

Byrne and Hahn also wanted to take a closer look at smaller volcanoes on Venus, those less than 3 miles across that have been overlooked by previous volcano hunters.

“They’re the most common volcanic feature on the planet: they represent about 99% of my dataset,” Hahn said. “We looked at their distribution using different spatial statistics to figure out whether the volcanoes are clustered around other structures on Venus, or if they’re grouped in certain areas.”

The new volcanoes dataset is hosted at Washington University and publicly available for other scientists to use.

“We’ve already heard from colleagues that they’ve downloaded the data and are starting to analyze it — which is exactly what we want,” Byrne said. “Other people will come up with questions we haven’t, about volcano shape, size, distribution, timing of activity in different parts of the planet, you name it. I’m excited to see what they can figure out with the new database!”

And if 85,000 volcanoes on Venus seems like a large number, Hahn said it’s actually conservative. She believes there are hundreds of thousands of additional geologic features that have some volcanic properties lurking on the surface of Venus. They’re just too small to get picked up.

“A volcano 1 kilometer in diameter in the Magellan data would be 7 pixels across, which is really hard to see,” Hahn said. “But with improved resolution, we could be able to resolve those structures.”

And it’s exactly that kind of data that future missions to Venus will acquire in the 2030s.

“NASA and ESA (the European Space Agency) are each sending a mission to Venus in the early 2030s to take high-resolution radar images of the surface,” Byrne said. “With those images, we’ll be able to search for those smaller volcanoes we predict are there.

“This is one of the most exciting discoveries we’ve made for Venus — with data that are decades old!” Byrne said. “But there are still a huge number of questions we have for Venus that we can’t answer, for which we have to get into the clouds and onto the surface.

“We’re just getting started,” he said.

A Morphological and Spatial Analysis of Volcanoes on Venus, Journal of Geophysical Research Planets (open access)

By Keith Cowing
Source SpaceRef

Strong Solar Flare Erupts From Sun

0
NASA’s Solar Dynamics Observatory captured this image of a solar flare – as seen in the bright flash on the bottom right of the Sun – on March 28, 2023. The image shows a subset of extreme ultraviolet light that highlights the extremely hot material in flares and which is colorized in teal. Credit: NASA/SDO

The Sun emitted a strong solar flare, peaking at 10:33 p.m. ET on March 28, 2023. NASA’s Solar Dynamics Observatory, which watches the Sun constantly, captured an image of the event.

Solar flares are powerful bursts of energy. Flares and solar eruptions can impact radio communications, electric power grids, navigation signals, and pose risks to spacecraft and astronauts.

This flare is classified as an X1.2 flare. X-class denotes the most intense flares, while the number provides more information about its strength.

To see how such space weather may affect Earth, please visit NOAA’s Space Weather Prediction Center https://spaceweather.gov/, the U.S. government’s official source for space weather forecasts, watches, warnings, and alerts. NASA works as a research arm of the nation’s space weather effort. NASA observes the Sun and our space environment constantly with a fleet of spacecraft that study everything from the Sun’s activity to the solar atmosphere, and to the particles and magnetic fields in the space surrounding Earth.

By Keith Cowing
Source SpaceRef

Astronomers Witness The Birth Of A Very Distant Cluster Of Galaxies From The Early Universe

0
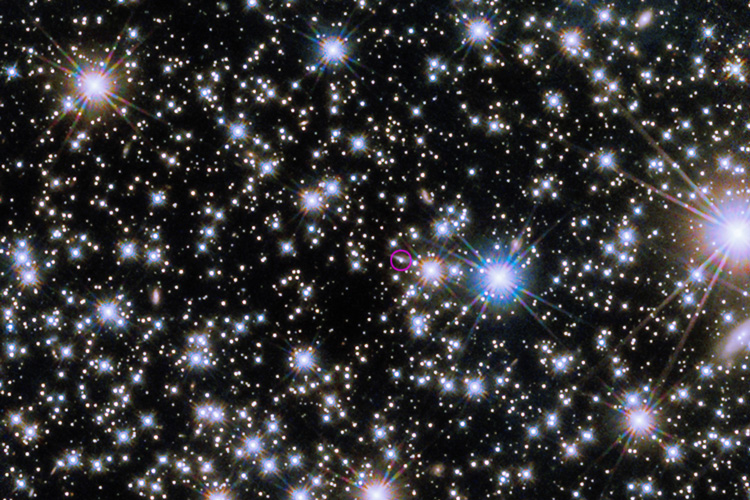
This image shows the protocluster around the Spiderweb galaxy (formally known as MRC 1138-262), seen at a time when the Universe was only 3 billion years old. Most of the mass in the protocluster does not reside in the galaxies that can be seen in the centre of the image, but in the gas known as the intracluster medium (ICM). The hot gas in the ICM is shown as an overlaid blue cloud. Credit: ESO/Di Mascolo et al.; HST: H. Ford

Using the Atacama Large Millimeter/submillimeter Array (ALMA), of which ESO is a partner, astronomers have discovered a large reservoir of hot gas in the still-forming galaxy cluster around the Spiderweb galaxy — the most distant detection of such hot gas yet. Galaxy clusters are some of the largest objects known in the Universe and this result, published today in Nature, further reveals just how early these structures begin to form.

Galaxy clusters, as the name suggests, host a large number of galaxies — sometimes even thousands. They also contain a vast “intracluster medium” (ICM) of gas that permeates the space between the galaxies in the cluster. This gas in fact considerably outweighs the galaxies themselves. Much of the physics of galaxy clusters is well understood; however, observations of the earliest phases of formation of the ICM remain scarce.

Previously, the ICM had only been studied in fully-formed nearby galaxy clusters. Detecting the ICM in distant protoclusters — that is, still-forming galaxy clusters – would allow astronomers to catch these clusters in the early stages of formation. A team led by Luca Di Mascolo, first author of the study and researcher at the University of Trieste, Italy, were keen to detect the ICM in a protocluster from the early stages of the Universe.

Galaxy clusters are so massive that they can bring together gas that heats up as it falls towards the cluster. “Cosmological simulations have predicted the presence of hot gas in protoclusters for over a decade, but observational confirmations has been missing,” explains Elena Rasia, researcher at the Italian National Institute for Astrophysics (INAF) in Trieste, Italy, and co-author of the study. “Pursuing such key observational confirmation led us to carefully select one of the most promising candidate protoclusters.” That was the Spiderweb protocluster, located at an epoch when the Universe was only 3 billion years old. Despite being the most intensively studied protocluster, the presence of the ICM has remained elusive. Finding a large reservoir of hot gas in the Spiderweb protocluster would indicate that the system is on its way to becoming a proper, long-lasting galaxy cluster rather than dispersing.

Di Mascolo’s team detected the ICM of the Spiderweb protocluster through what’s known as the thermal Sunyaev-Zeldovich (SZ) effect. This effect happens when light from the cosmic microwave background — the relic radiation from the Big Bang — passes through the ICM. When this light interacts with the fast-moving electrons in the hot gas it gains a bit of energy and its colour, or wavelength, changes slightly. “At the right wavelengths, the SZ effect thus appears as a shadowing effect of a galaxy cluster on the cosmic microwave background,” explains Di Mascolo.

By measuring these shadows on the cosmic microwave background, astronomers can therefore infer the existence of the hot gas, estimate its mass and map its shape. “Thanks to its unparalleled resolution and sensitivity, ALMA is the only facility currently capable of performing such a measurement for the distant progenitors of massive clusters,” says Di Mascolo.

They determined that the Spiderweb protocluster contains a vast reservoir of hot gas at a temperature of a few tens of millions of degrees Celsius. Previously, cold gas had been detected in this protocluster, but the mass of the hot gas found in this new study outweighs it by thousands of times. This finding shows that the Spiderweb protocluster is indeed expected to turn into a massive galaxy cluster in around 10 billion years, growing its mass by at least a factor of ten.

Tony Mroczkowski, co-author of the paper and researcher at ESO, explains that “this system exhibits huge contrasts. The hot thermal component will destroy much of the cold component as the system evolves, and we are witnessing a delicate transition.” He concludes that “it provides observational confirmation of long-standing theoretical predictions about the formation of the largest gravitationally bound objects in the Universe.”

These results help to set the groundwork for synergies between ALMA and ESO’s upcoming Extremely Large Telescope (ELT ), which “will revolutionise the study of structures like the Spiderweb,” says Mario Nonino, a co-author of the study and researcher at the Astronomical Observatory of Trieste. The ELT and its state-of-the-art instruments, such as HARMONI and MICADO, will be able to peer into protoclusters and tell us about the galaxies in them in great detail. Together with ALMA’s capabilities to trace the forming ICM, this will provide a crucial glimpse into the assembly of some of the largest structures in the early Universe.

More information

This research was presented in the paper “Forming intracluster gas in a galaxy protocluster at a redshift of 2.16” to appear in Nature (doi: 10.1038/s41586-023-05761-x)

The team is composed of Luca Di Mascolo (Astronomy Unit, University of Trieste, Italy [UT]; INAF – Osservatorio Astrofisico di Trieste, Italy [INAF Trieste]; IFPU – Institute for Fundamental Physics of the Universe, Italy [IFPU]), Alexandro Saro (UT; INAF Trieste; IFPU; INFN – Sezione di Trieste, Italy [INFN]), Tony Mroczkowski (European Southern Observatory, Germany [ESO]), Stefano Borgani (UT; INAF Trieste; IFPU; INFN), Eugene Churazov (Max-Planck-Institute für Astrophysik, Germany; Space Research Institute, Russia), Elena Rasia (INAF Trieste; IFPU), Paolo Tozzi (INAF – Osservatorio Astrofisico di Arcetri, Italy), Helmut Dannerbauer (Instituto de Astrofísica de Canarias, Spain; Universidad de La Laguna, Spain), Kaustuv Basu (Argel ander Institute for Astronomy, University of Bonn, Germany), Christopher L. Carilli (National Radio Astronomy Observatory, USA), Michele Ginolfi (ESO; Dipartimento di Fisica e Astronomia, University of Florence, Italy), George Miley (Leiden Observatory, Leiden University, Netherlands), Mario Nonino (UT), Maurilio Pannella (UT; INAF Trieste; IFPU), Laura Pentericci (INAF – Osservatorio Astronomico di Roma, Italy), Francesca Rizzo (Cosmic Dawn Center, Denmark; Niels Bohr Institute, Denmark)

The Atacama Large Millimeter/submillimeter Array (ALMA), an international astronomy facility, is a partnership of ESO, the U.S. National Science Foundation (NSF) and the National Institutes of Natural Sciences (NINS) of Japan in cooperation with the Republic of Chile. ALMA is funded by ESO on behalf of its Member States, by NSF in cooperation with the National Research Council of Canada (NRC) and the Ministry of Science and Technology (MOST) and by NINS in cooperation with the Academia Sinica (AS) in Taiwan and the Korea Astronomy and Space Science Institute (KASI). ALMA construction and operations are led by ESO on behalf of its Member States; by the National Radio Astronomy Observatory (NRAO), managed by Associated Universities, Inc. (AUI), on behalf of North America; and by the National Astronomical Observatory of Japan (NAOJ) on behalf of East Asia. The Joint ALMA Observatory (JAO) provides the unified leadership and management of the construction, commissioning and operation of ALMA.

Forming intracluster gas in a galaxy protocluster at a redshift of 2.16, ESO (open access)

By Keith Cowing
Source SpaceRef