Home Blog Page 77

Naval Research Laboratory To Launch First In-Space Laser Power Beaming Experiment

0
Space Wireless Energy Laser Link (SWELL) – NRL

The U.S. Naval Research Laboratory is set to launch the Space Wireless Energy Laser Link (SWELL) to demonstrate laser power beaming in space as part of the scheduled U.S. Department of Defense Space Test Program (STP) H9 mission to the International Space Station (ISS) March 15.

SWELL is one of several experiments that will launch aboard the SpaceX Dragon cargo vehicle to the ISS for the yearlong mission to collect data during a laser power beaming link in space conditions. The experiment, which is sponsored by the Office of the Under Secretary of Defense for Acquisition & Sustainment (OUSD (A&S)) and supported by the Operational Energy Capability Improvement Fund (OECIF), will explore challenges for power beaming’s viability for space applications, and also highlight the possibilities for using power beaming to address energy challenges on Earth.

“With this modest experiment, we will identify key focus areas for developing links of greater power and longer distance for space,” said Paul Jaffe, Ph.D., Electronics Engineer and SWELL Principal Investigator. “By employing laser transmitters and photovoltaic receivers, power beaming links will be established that will pave the way for rapid, resilient, and flexible energy delivery systems.”

Power beaming is a means of delivering energy in the form of electromagnetic waves that does not require the transport of mass, so energy can be sent almost instantly. Its feasibility and safety have been proven on the ground, and now these efforts are expanding to space.

“This is the next step in extending this capability for space, lunar, and planetary applications,” said Chris DePuma, SWELL Program Manager. “Power beaming is poised as a critical enabler for power distribution on the moon and elsewhere in space.”

The yearlong SWELL experiment should provide data that shows how the hardware functions in the space environment and show which constraints are likely to affect the deployment of future operational systems.

By eliminating the need for moving fuel or batteries, or for stringing wires, SWELL could be a compelling option for the utilization of lunar resources and development on the Moon.

“Power beaming might also be used for distributing power for and around Earth, including from satellites that collect solar energy in space,” Jaffe said. “SWELL is the next step into this new frontier.”

About the U.S. Naval Research Laboratory

NRL is a scientific and engineering command dedicated to research that drives innovative advances for the U.S. Navy and Marine Corps from the seafloor to space and in the information domain. NRL is located in Washington, D.C. with major field sites in Stennis Space Center, Mississippi; Key West, Florida; Monterey, California, and employs approximately 3,000 civilian scientists, engineers and support personnel.

For more information, contact NRL Corporate Communications at (202) 480-3746 or [email protected].

By Keith Cowing
Source SpaceRef

Artificial Intelligence Finds The First Stars Were Not Alone

0
Carbon vs. iron abundance of extremely metal-poor (EMP) stars. The colour bar shows the probability for mono-enrichment from our machine learning algorithm. Stars above the dashed lines (at [C/Fe] = 0.7) are called carbon-enhanced metal-poor (CEMP) stars and most of them are mono-enriched. CREDIT Hartwig et al. Kavli Institute for the Physics and Mathematics of the Universe

By using machine learning and state-of-the-art supernova nucleosynthesis, a team of researchers have found the majority of observed second-generation stars in the universe were enriched by multiple supernovae, reports a new study in The Astrophysical Journal.

Nuclear astrophysics research has shown elements including and heavier than carbon in the universe are produced in stars. But the first stars, stars born soon after the Big Bang, did not contain such heavy elements, which astronomers call ‘metals’. The next generation of stars contained only a small amount of heavy elements produced by the first stars. To understand the universe in its infancy, it requires researchers to study these metal-poor stars.

Luckily, these second-generation metal-poor stars are observed in our Milky Way Galaxy, and have been studied by a team of Affiliate Members of the Kavli Institute for the Physics and Mathematics of the Universe (Kavli IPMU) to close in on the physical properties of the first stars in the universe.

The team, led by Kavli IPMU Visiting Associate Scientist and The University of Tokyo Institute for Physics of Intelligence Assistant Professor Tilman Hartwig, including Visiting Associate Scientist and National Astronomical Observatory of Japan Assistant Professor Miho Ishigaki, Visiting Senior Scientist and University of Hertfordshire Professor Chiaki Kobayashi, Visiting Senior Scientist and National Astronomical Observatory of Japan Professor Nozomu Tominaga, and Visiting Senior Scientist and The University of Tokyo Professor Emeritus Ken’ichi Nomoto, used artificial intelligence to analyze elemental abundances in more than 450 extremely metal-poor stars observed to date. Based on the newly developed supervised machine learning algorithm trained on theoretical supernova nucleosynthesis models, they found that 68 per cent of the observed extremely metal-poor stars have a chemical fingerprint consistent with enrichment by multiple previous supernovae.

The team’s results give the first quantitative constraint based on observations on the multiplicity of the first stars.

“Multiplicity of the first stars were only predicted from numerical simulations so far, and there was no way to observationally examine the theoretical prediction until now”, said lead author Hartwig. “Our result suggests that most first stars formed in small clusters so that multiple of their supernovae can contribute to the metal enrichment of the early interstellar medium,” he said.

“Our new algorithm provides an excellent tool to interpret the big data we will have in the next decade from on-going and future astronomical surveys across the world” said Kobayashi, also a Leverhulme Research Fellow.

“At the moment, the available data of old stars are the tip of the iceberg within the solar neighborhood. The Prime Focus Spectrograph, a cutting-edge multi-object spectrograph on the Subaru Telescope developed by the international collaboration led by Kavli IPMU, is the best instrument to discover ancient stars in the outer regions of the Milky Way far beyond the solar neighborhood.”, said Ishigaki.

The new algorithm invented in this study opens the door to make the most of diverse chemical fingerprints in metal-poor stars discovered by the Prime Focus Spectrograph.

“The theory of the first stars tells us that the first stars should be more massive than the Sun. The natural expectation was that the first star was born in a gas cloud containing the mass million times more than the Sun. However, our new finding strongly suggests that the first stars were not born alone, but instead formed as a part of a star cluster or a binary or multiple star system. This also means that we can expect gravitational waves from the first binary stars soon after the Big Bang, which could be detected future missions in space or on the Moon,” said Kobayashi.

Hartwig has made the code developed in this study publicly available at https://gitlab.com/thartwig/emu-c.

Details of their study were published on March 22 in The Astrophysical Journal.

Machine learning detects multiplicity of the first stars in stellar archaeology data, The Astrophysical Journal

By Keith Cowing
Source SpaceRef

Hubble Monitors Changing Weather And Seasons At Jupiter And Uranus

0

SUMMARY

FORECAST FOR BLUSTERY WINDS, SMOGGY HAZES

The outer planets beyond Mars do not have solid surfaces to affect weather as on Earth. And, sunlight is much less able to drive atmospheric circulation. Nevertheless, these are ever-changing worlds. And Hubble – as interplanetary meteorologist – is keeping track, as it does every year. Jupiter’s weather is driven from inside-out as more heat percolates up from its interior than it receives from the Sun. This heat indirectly drives color change cycles highlighting a system of alternating cyclones and anticyclones. Uranus has seasons that pass by at a snail’s pace because it takes 84 years to complete one orbit about the Sun. The seasons are extreme because Uranus is tipped on its side. As summer approaches in the northern hemisphere, Hubble sees a growing polar cap of high-altitude photochemical haze that looks similar to the smog over cities on Earth.

FULL ARTICLE

Ever since its launch in 1990, NASA’s Hubble Space Telescope has been an interplanetary weather observer, keeping an eye on the largely gaseous outer planets and their ever-changing atmospheres. NASA spacecraft missions to the outer planets have given us a close-up look at these atmospheres, but Hubble’s sharpness and sensitivity keeps an unblinking eye on a kaleidoscope of complex activities over time. In this way Hubble complements observations from other spacecraft such as Juno, currently orbiting Jupiter; the retired Cassini mission to Saturn, and the Voyager 1 and 2 probes, which collectively flew by all four giant planets between 1979 and 1989.

Inaugurated in 2014, the telescope’s Outer Planet Atmospheres Legacy (OPAL) Program has been providing us with yearly views of the giant planets. Here are some recent images:

Jupiter

[left]—The forecast for Jupiter is stormy weather at low northern latitudes. A prominent string of alternating storms is visible, forming a “vortex street” as some planetary astronomers call it. This is a wave pattern of nested anticyclones and cyclones, locked together like in a machine with alternating gears moving clockwise and counterclockwise. If the storms get close enough to each other, in the very unlikely event of a merger, they could build an even larger storm, potentially rivaling the current size of the Great Red Spot. The staggered pattern of anticyclones and cyclones prevents individual storms from merging. Activity is also seen interior to these storms; in the 1990s Hubble didn’t see any cyclones or anticyclones with built-in thunderstorms, but these storms have sprung up the last decade. Strong color differences indicate that Hubble is seeing different cloud heights and depths as well.

The orange moon Io photobombs this view of Jupiter’s multicolored cloud tops, casting a shadow toward the planet’s western limb. Hubble’s resolution is so sharp that it can see Io’s mottled-orange appearance, related to its numerous active volcanoes. These volcanoes were first discovered when the Voyager 1 spacecraft flew by in 1979. The moon’s molten interior is overlaid by a thin crust through which the volcanoes eject material. Sulfur takes on various hues at different temperatures, which is why Io’s surface is so colorful. This image was taken on November 12, 2022.

[right]—Jupiter’s legendary Great Red Spot takes center stage in this view. Though this vortex is big enough to swallow Earth, it has actually shrunken to the smallest size it has ever been over observation records dating back 150 years. Jupiter’s icy moon Ganymede can be seen transiting the giant planet at lower right. Slightly larger than the planet Mercury, Ganymede is the largest moon in the solar system. It is a cratered world with a mainly water-ice surface with apparent glacial flows driven by internal heat. (This image is smaller in size because Jupiter was 81,000 miles farther from Earth when the photo was taken). This image was taken on January 6, 2023.

Uranus

Planetary oddball Uranus rolls on its side around the Sun as it follows an 84-year orbit, rather than spinning in a more-vertical position as Earth does. Uranus has a weirdly tipped “horizontal” rotation axis angled just eight degrees off the plane of the planet’s orbit. One recent theory proposes that Uranus once had a massive moon that gravitationally destabilized it and then crashed into it. Other possibilities include giant impacts during planetary formation, or even giant planets exerting resonant torques on each other over time. The consequences of the planet’s tilt are that for stretches of time lasting up to 42 years, parts of one hemisphere are completely without sunlight. When the Voyager 2 spacecraft visited during the 1980s, the planet’s south pole was pointed almost directly at the Sun. Hubble’s latest view shows the northern pole now tipping toward the Sun.

[left]—This is a Hubble view of Uranus taken in 2014, seven years after northern spring equinox when the Sun was shining directly over the planet’s equator, and shows one of the first images from the OPAL program. Multiple storms with methane ice-crystal clouds appear at mid-northern latitudes above the planet’s cyan-tinted lower atmosphere. Hubble photographed the ring system edge-on in 2007, but the rings are seen starting to open up seven years later in this view. At this time, the planet had multiple small storms and even some faint cloud bands.

[right]—As seen in 2022, Uranus’ north pole shows a thickened photochemical haze that looks similar to the smog over cities. Several little storms can be seen near the edge of the polar haze boundary. Hubble has been tracking the size and brightness of the north polar cap and it continues to get brighter year after year. Astronomers are disentangling multiple effects—from atmospheric circulation, particle properties, and chemical processes—that control how the atmospheric polar cap changes with the seasons. At the Uranian equinox in 2007, neither pole was particularly bright. As northern summer solstice approaches in 2028 the cap may grow brighter still, and will be aimed directly toward Earth, allowing good views of the rings and north pole; the ring system will then appear face-on. This image was taken on November 10, 2022.

About Hubble

The Hubble Space Telescope is a project of international cooperation between NASA and ESA. NASA’s Goddard Space Flight Center in Greenbelt, Maryland, manages the telescope. The Space Telescope Science Institute (STScI) in Baltimore conducts Hubble science operations. STScI is operated for NASA by the Association of Universities for Research in Astronomy, in Washington, D.C.

ABOUT THIS RELEASE

Credits

MEDIA CONTACT:

Ray Villard
Space Telescope Science Institute, Baltimore, Maryland

SCIENCE CONTACT:

Amy Simon
NASA Goddard Space Flight Center, Greenbelt, Maryland

Michael H. Wong
University of California, Berkeley, Berkeley, California

Celebrating Women In STEM

0

Dr. Christyl Johnson, deputy director for technology and research investments at NASA’s Goddard Space Flight Center, speaks during a panel discussion as part of a Women’s History Month program, “Celebrating Women Who Tell Our Stories,” on Wednesday, March 22, 2023. The panel marked the launch of a new campaign to mobilize women at NASA to participate in student-centered activities as STEM mentors and role models.

Image Credit: NASA/Aubrey Gemignani

By Monika Luabeya
Source NASA

Joint NASA, CNES Water-Tracking Satellite Reveals First Stunning Views

0

The international Surface Water and Ocean Topography (SWOT) mission – led by NASA and the French space agency Centre National d’Études Spatiales (CNES) – has sent back some of its first glimpses of water on the planet’s surface, showing ocean currents like the Gulf Stream in unprecedented detail. SWOT is also capturing views of freshwater features such as lakes, rivers, and other water bodies down to about 300 feet (100 meters) wide.

The satellite will measure the elevation of nearly all the water on Earth’s surface and provide one of the most comprehensive surveys yet of our planet’s surface water. SWOT’s measurements of freshwater bodies and the ocean will provide insights into how the ocean influences climate change and the water cycle; how a warming world affects water storage in lakes, rivers, and reservoirs; and how communities can better manage their water resources and prepare for floods and other disasters.

“SWOT’s advanced imagery will empower researchers and advance the way we manage fresh water and the effects of sea level rise across the globe,” said NASA Administrator Bill Nelson. “Water is one of our planet’s most important resources – and it’s proven to be vulnerable to the impacts of climate change. SWOT will provide critical information that communities can use to prepare for the impacts of a warming climate.”

A Whole New View

This visualization shows water features on New York’s Long Island – shown as bright pink splotches. Purple, yellow, green, and dark blue shades represent different land elevations, while the surrounding ocean is a lighter blue. The data was collected on Jan. 21, 2023, by SWOT’s KaRIn instrument. Credit: NASA/JPL-Caltech

As seen in these early images, on Jan. 21, 2023, SWOT measured sea level in a part of the Gulf Stream off the coast of North Carolina and Virginia. The two antennas of SWOT’s Ka-band Radar Interferometer (KaRIn) instrument acquired data that was mapped as a pair of wide, colored strips spanning a total of 75 miles (120 kilometers) across. Red and orange areas in the images represent sea levels that are higher than the global average, while the shades of blue represent sea levels that are lower than average.

For comparison, the new data is shown alongside sea surface height data taken by space-based instruments called altimeters. The instruments – widely used to measure sea level – also bounce radar signals off of Earth’s surface to collect their measurements. But traditional altimeters are able to look only at a narrow beam of Earth directly beneath them, unlike KaRIn’s two wide-swath strips that observe sea level as a two-dimensional map.

The spatial resolution of SWOT ocean measurements is 10 times greater than the composite of sea surface height data gathered over the same area by seven other satellites: Sentinel-6 Michael Freilich, Jason-3, Sentinel-3A and 3B, Cryosat-2, Altika, and Hai Yang 2B. The composite image was created using information from the Copernicus Marine Service of ESA (European Space Agency) and shows the same day as the SWOT data.

KaRIn also measured the elevation of water features on Long Island – shown as bright pink splotches nestled within the landscape. (Purple, yellow, green, and blue shades represent different land elevations.)

“Our ability to measure freshwater resources on a global scale through satellite data is of prime importance as we seek to adjust to a changing climate,” said CNES Chairman and CEO Philippe Baptiste. “In this respect, the first views from SWOT give us a clearer picture than ever before. These data will prove highly valuable for the international scientific community in the fields of hydrology, oceanography, and coastal studies.”

This initial inland image is a tantalizing indication of how SWOT can measure details of smaller lakes, ponds, and rivers in ways that satellites could not before. Such data will be used to produce an extraordinary accounting of the freshwater on Earth’s surface in ways useful to researchers, policymakers, and water resource managers.

“The KaRIn instrument took years to develop and build, and it will collect information on bodies of water across the globe – data that will be freely and openly available to everybody who needs it,” said Parag Vaze, SWOT project manager at NASA’s Jet Propulsion Laboratory in Southern California.

More About the Mission

Launched on Dec. 16, 2022, from Vandenberg Space Force Base in central California, SWOT is now in a period of commissioning, calibration, and validation. Engineers are checking out the performance of the satellite’s systems and science instruments before the planned start of science operations in summer 2023.

The data for these first images was collected by SWOT’s KaRIn instrument, the scientific heart of the satellite. KaRIn has one antenna at each end of a boom that’s 33 feet (10 meters) long. This enables the instrument to look off to either side of a center line directly below the satellite as it bounces microwave signals off Earth’s surface. The returning radar signals arrive at each antenna slightly out of sync, or phase, from one another. When these signals are combined with other information about the antennas and the satellite’s altitude, scientists will be able to map the height of water on Earth’s surface with never-before-seen clarity. KaRIn encountered an issue earlier this year with one of its subsystems; engineers have now resolved the situation, and the instrument is up and running.

SWOT was jointly developed by NASA and CNES, with contributions from the Canadian Space Agency (CSA) and the UK Space Agency. JPL, which is managed for NASA by Caltech in Pasadena, California, leads the U.S. component of the project. For the flight system payload, NASA provided the KaRIn instrument, a GPS science receiver, a laser retroreflector, a two-beam microwave radiometer, and NASA instrument operations. CNES provided the Doppler Orbitography and Radioposition Integrated by Satellite (DORIS) system, the dual frequency Poseidon altimeter (developed by Thales Alenia Space), the KaRIn radio-frequency subsystem (together with Thales Alenia Space and with support from the UK Space Agency), the satellite platform, and ground operations. CSA provided the KaRIn high-power transmitter assembly. NASA provided the launch vehicle and the agency’s Launch Services Program, based at Kennedy Space Center, managed the associated launch services.

To learn more about SWOT, visit: https://swot.jpl.nasa.gov/

Jane Platt / Andrew Good
818-354-0880 / 818-393-2433
[email protected] / [email protected]

Experiments To Study Child Brain Tumours And Muscle Ageing Heading To Space

0

Due to be ready for launch in 2025, the experiments will be supervised by astronauts on board for up to six months before returning to Earth for the results to be analysed.

D(MG)2, led by the Institute of Cancer Research, received £1.2 million to look at diffuse midline glioma; the second most common type of “primary high grade” brain tumour in children that has, so far, been impossible to cure due to the amount of different cell types it contains.

MicroAge II, led by the University of Liverpool, was awarded £1.4 million funding for the second part of its project investigating how the microgravity environment makes astronauts’ muscles weaken in space, in an accelerated way to how muscles get weaker as we age on Earth.

Minister of State at the Department for Science, Innovation and Technology, George Freeman, said:

Space is the ultimate laboratory testbed with British scientists and astronauts harnessing the International Space Station for cutting edge research in nutrition, energy and biomedicine.

This £2.6m project funding will help UK scientists research how to prevent brain tumours in children, and understand the biomedical processes of ageing: research with huge benefits for mankind and health systems around the world.

Another example of the way UK strengths in different sectors from space to life science and cleantech drive technology leadership.

Dr Paul Bate, Chief Executive of the UK Space Agency, said:

This ground-breaking research highlights the power of space to push through barriers, revolutionise science and enhance our lives.

Through a combination of national funding and our vital role in the European Space Agency, we’re ensuring UK scientists have access to the unique environment of the ISS for their research, which will benefit us all.

Announced during Brain Tumour Awareness Month, the ISS experiment for D(MG)2 will use microgravity to get a clearer picture of how diffuse midline glioma cells react with each other, so that potential new avenues for developing novel treatments can be identified.

Professor of Childhood Cancer Biology at The Institute of Cancer Research, Chris Jones, said:

Unfortunately, survival rates for patients with diffuse midline glioma have not changed substantially since Neil Armstrong’s daughter died of the disease in the early sixties. The last 15 years, however, have revolutionised our understanding of the biological complexity of these tumours, with exciting new therapies entering clinical trial at last.

Experiments such as D(MG)2 aboard the International Space Station will improve our understanding of how cancer cells interact with each other within three-dimensional structures, and hopefully lead to new ideas for disrupting tumour growth that we can take forward back in the lab.

The ISS experiment for MicroAge II will use a lab-grown human muscle to observe the effects of microgravity and test whether mitochondria play an important role in muscle loss in space and determine whether applying tension can slow the degeneration process, which could help scientists to rapidly develop therapies to reduce muscle loss as we age.

The UK Space Agency supported MicroAge I, which flew to the ISS in December 2021 to test lab-grown muscle constructs, each the size of a grain of rice.

University of Liverpool’s Professor Malcolm Jackson said:

We are delighted to receive this generous funding from the UK Space Agency to develop our studies of the effects of microgravity on loss of skeletal muscle as a model from which we can further understand muscle loss during ageing.

We will use newly developed techniques to study the role of changes in mitochondria, tiny structures that are responsible for supplying energy to cells, in driving the loss of muscle mass that occurs in microgravity.

The role that a loss of tension on muscle plays in these mitochondrial changes will be examined using innovative hardware that we are developing with Kayser Space Ltd which modifies the amount of tension that the muscle experiences in microgravity.

This will be used to test whether altered tension on muscle regulates the muscle loss in microgravity and to inform us on the process during muscle loss during ageing on Earth.

Equipment for the experiments is built by microgravity hardware specialists, Kayser Space, based in Oxfordshire.

Managing Director of Kayser Space Ltd, David Zolesi, said:

We are thrilled to be involved in these two new UK Space Agency funded programmes and to support scientists investigating these cutting-edge research fields.

Our role, as experts in the design and supply of instruments and systems used in outer space and especially in crewed spaceflight, is to provide public and private research groups with the tools to conduct their research and obtain great results for the benefit and well-being of all humankind.

Hot Sand Clouds On A Young Gas-Giant Planet Orbiting Two Stars

0
A study co-authored by Southwest Research Institute Senior Research Scientist Dr. Jason Hofgartner explains the unusual radar signatures of icy satellites orbiting Jupiter and Saturn. Their radar signatures, which differ significantly from those of rocky worlds and most ice on Earth, have long been a vexing question for the scientific community. CREDIT NASA/JPL-Caltech/SwRI

A study co-authored by Southwest Research Institute Senior Research Scientist Dr. Jason Hofgartner explains the unusual radar signatures of icy satellites orbiting Jupiter and Saturn. Their radar signatures, which differ significantly from those of rocky worlds and most ice on Earth, have long been a vexing question for the scientific community.

“Six different models have been published in an attempt to explain the radar signatures of the icy moons that orbit Jupiter and Saturn,” said Hofgartner, first author of the study, which was published this month in Nature Astronomy. “The way these objects scatter radar is drastically different than that of the rocky worlds, such as Mars and Earth, as well as smaller bodies such as asteroids and comets.”

The objects are also extremely bright, even in areas where they should be darker.

“When we look up at Earth’s moon it looks like a circular disk, even though we know it’s a sphere. Planets and other moons similarly look like disks through telescopes,” Hofgartner said. “While making radar observations, the center of the disk is very bright and the edges much darker. The change from center to edge is very different for these icy satellites than for rocky worlds.”

In collaboration with Dr. Kevin Hand of NASA’s Jet Propulsion Laboratory, Hofgartner argues that the extraordinary radar properties of these satellites, such as their reflectiveness and polarization (the orientation of light waves as they propagate through space) is very likely to be explained by the coherent backscatter opposition effect (CBOE).

“When you’re at opposition, the Sun is positioned directly behind you on the line between you and an object, the surface appears much brighter than it would otherwise,” Hofgartner said. “This is known as the opposition effect. In the case of radar, a transmitter stands in for the Sun and a receiver for your eyes.”

An icy surface, Hofgartner explained, has an even stronger opposition effect than normal. For every scattering path of light bouncing through the ice, at opposition there is a path in the exact opposite direction. Because the two paths have precisely the same length, they combine coherently, resulting in further brightening.

In the 1990s, studies were published stating that the CBOE was one explanation for the anomalous radar signatures of icy satellites, but other explanations could explain the data equally well. Hofgartner and Hand improved the polarization description of the CBOE model and also showed that their modified CBOE model is the only published model that can explain all of the icy satellite radar properties.

“I think that tells us that the surfaces of these objects and their subsurfaces down to many meters are very tortured,” Hofgartner said. “They’re not very uniform. Icy rocks dominate the landscape, perhaps looking somewhat like the chaotic mess after a landslide. That would explain why the light is bouncing in so many different directions, giving us these unusual polarization signatures.”

The radar observations Hofgartner and Hand used were from the Arecibo Observatory, which was one of only two telescopes making radar observations of icy satellites until it was severely damaged by the collapse of its support structure, antenna and dome assembly and subsequently decommissioned. The researchers hope to make follow-up observations when possible and plan to study additional archival data that may shed even more light on icy satellites and the CBOE, as well as radar studies of ice at the poles of Mercury, the Moon, and Mars.

The paper “An icy-satellite radar-properties continuum that requires the coherent backscatter effect,” appears in Nature Astronomy: https://www.nature.com/articles/s41550-023-01920-2

By Keith Cowing
Source SpaceRef

NASA’s Webb Spots Swirling, Gritty Clouds On Remote Planet

0
This illustration shows the swirling clouds identified by the James Webb Space Telescope in the atmosphere of exoplanet VHS 1256 b. The planet is about 40 light-years away and orbits two stars. The planet’s clouds, which are filled with silicate dust, are constantly rising, mixing, and moving. Credit: NASA, ESA, CSA, Joseph Olmsted (STScI) Full Image Details

In just a few hours of observations, the space telescope revealed a dynamic atmosphere on a planet 40 light-years from Earth.

Researchers observing with NASA’s James Webb Space Telescope have pinpointed silicate cloud features in a distant planet’s atmosphere. The atmosphere is constantly rising, mixing, and moving during its 22-hour day, bringing hotter material up and pushing colder material down. The resulting brightness changes are so dramatic that it is the most variable planetary-mass object known to date. The team, led by Brittany Miles of the University of Arizona, also made extraordinarily clear detections of water, methane, and carbon monoxide with Webb’s data, and found evidence of carbon dioxide. This is the largest number of molecules ever identified all at once on a planet outside our solar system.

Cataloged as VHS 1256 b, the planet is about 40 light-years away and orbits not one, but two stars over a 10,000-year period. “VHS 1256 b is about four times farther from its stars than Pluto is from our Sun, which makes it a great target for Webb,” Miles said. “That means the planet’s light is not mixed with light from its stars.” Higher up in its atmosphere, where the silicate clouds are churning, temperatures reach a scorching 1,500 degrees Fahrenheit (830 degrees Celsius).

Graphic titled “Exoplanet VHS 1256 b Emission Spectrum.” The label at top right reads “NIRSpec and MIRI, IFU Medium-Resolution Spectroscopy.” The spectrum is plotted on a graph.
Instruments aboard the James Webb Space Telescope known as spectrographs, one on its Near Infrared Spectrograph (NIRSpec) and another on its Mid-Infrared Instrument (MIRI), observed planet VHS 1256 b. The resulting spectrum shows signatures of silicate clouds, water, methane, and carbon monoxide. 

Credit: NASA, ESA, CSA, J. Olmsted (STScI); Science: Brittany Miles (University of Arizona), Sasha Hinkley (University of Exeter), Beth Biller (University of Edinburgh), Andrew Skemer (University of California, Santa Cruz)

Within those clouds, Webb detected both larger and smaller silicate dust grains, which are shown on a spectrum. “The finer silicate grains in its atmosphere may be more like tiny particles in smoke,” noted co-author Beth Biller of the University of Edinburgh in Scotland. “The larger grains might be more like very hot, very small sand particles.”

VHS 1256 b has low gravity compared to more massive brown dwarfs, which means that its silicate clouds can appear and remain higher in its atmosphere where Webb can detect them. Another reason its skies are so turbulent is the planet’s age. In astronomical terms, it’s quite young. Only 150 million years have passed since it formed – and it will continue to change and cool over billions of years.

In many ways, the team considers these findings to be the first “coins” pulled out of a spectrum that researchers view as a treasure chest of data. They’ve only begun identifying its contents. “We’ve identified silicates, but better understanding which grain sizes and shapes match specific types of clouds is going to take a lot of additional work,” Miles said. “This is not the final word on this planet – it is the beginning of a large-scale modeling effort to fit Webb’s complex data.”

Although all of the features the team observed have been spotted on other planets elsewhere in the Milky Way by other telescopes, other research teams typically identified only one at a time. “No other telescope has identified so many features at once for a single target,” said co-author Andrew Skemer of the University of California, Santa Cruz. “We’re seeing a lot of molecules in a single spectrum from Webb that detail the planet’s dynamic cloud and weather systems.”

The team came to these conclusions by analyzing data known as spectra gathered by two instruments aboard Webb, the Near-Infrared Spectrograph (NIRSpec) and the Mid-Infrared Instrument (MIRI). Since the planet orbits at such a great distance from its stars, the researchers were able to observe it directly, rather than using the transit technique or a coronagraph to take this data.

There will be plenty more to learn about VHS 1256 b in the months and years to come as this team – and others – continue to sift through Webb’s high-resolution infrared data. “There’s a huge return on a very modest amount of telescope time,” Biller added. “With only a few hours of observations, we have what feels like unending potential for additional discoveries.”

What might become of this planet billions of years from now? Since it’s so far from its stars, it will become colder over time, and its skies may transition from cloudy to clear.

The researchers observed VHS 1256 b as part of Webb’s Early Release Science program, which is designed to help transform the astronomical community’s ability to characterize planets and the disks where they form.

The team’s paper, entitled “The JWST Early Release Science Program for Direct Observations of Exoplanetary Systems II: A 1 to 20 Micron Spectrum of the Planetary-Mass Companion VHS 1256-1257 b,” will be published in The Astrophysical Journal Letters on March 22.

More About the Mission

The James Webb Space Telescope is the world’s premier space science observatory. Webb will solve mysteries in our solar system, look beyond to distant worlds around other stars, and probe the mysterious structures and origins of our universe and our place in it. Webb is an international program led by NASA with its partners, ESA (European Space Agency), and CSA (Canadian Space Agency).

MIRI was developed through a 50-50 partnership between NASA and ESA. NASA’s Jet Propulsion Laboratory led the U.S. efforts for MIRI, and a multinational consortium of European astronomical institutes contributes for ESA. George Rieke with the University of Arizona is the MIRI science team lead. Gillian Wright is the MIRI European principal investigator. Alistair Glasse with UK ATC is the MIRI instrument scientist, and Michael Ressler is the U.S. project scientist at JPL. Laszlo Tamas with UK ATC manages the European Consortium. The MIRI cryocooler development was led and managed by JPL, in collaboration with Northrop Grumman in Redondo Beach, California, and NASA’s Goddard Space Flight Center in Greenbelt, Maryland. Caltech manages JPL for NASA.

For more information about the Webb mission, visit: https://www.nasa.gov/webb

News Media Contact

Laura Betz
Goddard Space Flight Center, Greenbelt, Md.
[email protected]

Claire Blome / Christine Pulliam
Space Telescope Science Institute, Baltimore, Md.
[email protected] / [email protected]

Calla Cofield
Jet Propulsion Laboratory, Pasadena, Calif.
626-808-2469
[email protected]

Space Station Star Trail

0

Stars leave streaks of light in concentric circles in this March 16, 2012, view from the International Space Station. To create this composite long exposure, NASA astronaut Don Pettit combined multiple 30-second exposures from a mounted camera on the space station into one image.

The orbiting laboratory travels 5 miles per second, traveling around our planet every 90 minutes.

Image Credit: NASA/Don Pettit

By Monika Luabeya
Source NASA

SOFIA Reveals Map Of Moon’s Water Near Its South Pole Artemis Landing Sites

0
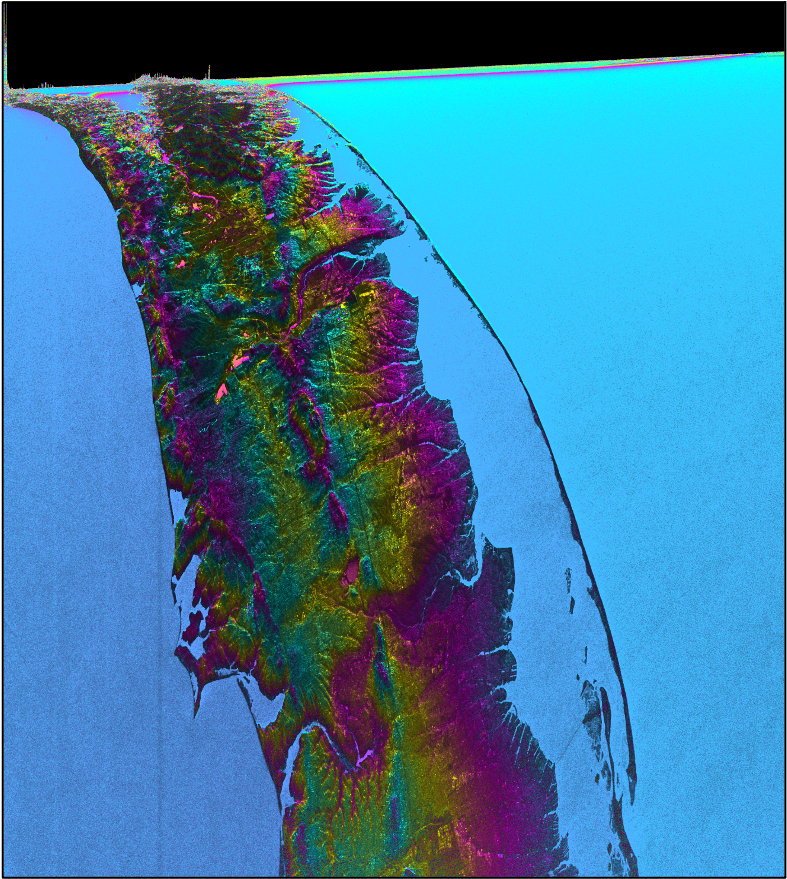
A still image of the Moon and the southern portion of the SOFIA data. NASA

A new study using NASA’s and DLR’s now-retired Stratospheric Observatory for Infrared Astronomy (SOFIA) has pieced together the first detailed, wide-area map of water distribution on the Moon.

With clear, identifiable lunar features marked out by the water data, the study provides hints about how water may be moving across the Moon’s surface, particularly near its South Pole — an important area for space exploration. The results were presented at a press conference at the 2023 Lunar and Planetary Society Conference in Houston, TX today.

The new map covers about one-quarter of the Earth-facing side of the lunar surface, below 60 degrees latitude and extends to the Moon’s South Pole. Given the large region covered, the researchers could easily identify how water relates to surface features on the Moon, staying away from sunlight and favoring cold areas.

“When looking at the water data, we can actually see crater rims, we see the individual mountains, and we can even see differences between the day and night sides of the mountains, thanks to the higher concentration of water in these places,” said Bill Reach, lead author of the paper and director at Universities Space Research Association and director of the SOFIA Science Center at NASA’s Ames Research Center in California’s Silicon Valley.

This finding, along with two previous SOFIA results about the amount and distribution of water on the Moon’s sunlit surface, tracks a unique light signature of water. Other missions observing wide areas of the lunar surface have studied different wavelengths of light, which can’t distinguish water from similar molecules, such as hydroxyl. The Moon’s water is present in the soil and might be found as ice crystals, or as water molecules chemically bound to other materials.

Instead of determining the absolute quantity of water in the region, the researchers compared the data obtained around the Moon’s South Pole to a relatively dry reference region near the Moon’s equator to see how its abundance changes. The water was found in greater concentrations on the shadowed sides of craters and mountains, similar to the way skiers on Earth know the slopes receiving less direct sun retain snow longer. This suggests the Moon’s local geography plays an important role in the amount of water present.

In late 2024, NASA’s Volatiles Investigating Polar Exploration Rover (VIPER) will land in the region studied by SOFIA, atop Mons Mouton, to conduct the first resource mapping mission beyond Earth. The flat-topped lunar mountain will be a region of emphasis in the next paper from the team that led the current study of SOFIA data.

And, as NASA prepares to send astronauts back to the Moon under Artemis, the agency has identified 13 candidate landing regions near the lunar South Pole. Through Artemis, NASA will land the first woman and the first person of color on the Moon, and lunar water will be a critical resource for establishing a long-term human presence.

“With this map of SOFIA data, and others to come, we are looking at how water is concentrated under different lunar environmental conditions,” said Casey Honniball, a visiting assistant research scientist and VIPER science team member at NASA’s Goddard Space Flight Center, in Greenbelt, Maryland, who was involved in the work. “This map will provide valuable information for the Artemis program on potential prospecting areas but also provides regional context for future missions, like VIPER.”

In addition to the southern region for which the new map results were created, SOFIA observations of sites relevant to other missions are in the archive and now being analyzed. NASA Artemis-related missions will target both polar and non-polar regions, including Lunar Trailblazer, which will orbit the Moon to map its hydroxyl and water.

Where the Moon’s water may be coming from — whether it exists inherently in the Moon’s minerals or is exclusively delivered by comets and solar wind, and whether it is migrating along the Moon’s surface — is another important question left open by the SOFIA observations. VIPER will aim to better understand this distinction, which is important in determining if the water is widespread and deep within the surface, or only scattered at or near the surface.

It’s clear, however, that even at its lowest limit, the Moon contains much more water than we once believed.

“Our common knowledge from the Apollo era that the Moon is bone dry was wrong,” said Paul Lucey, a professor at the University of Hawaii at Mānoa and co-author on the paper. “We already know it’s wrong, but the question is by how much.”

SOFIA was a joint project of NASA and the German Space Agency at DLR. DLR provided the telescope, scheduled aircraft maintenance, and other support for the mission. NASA’s Ames Research Center in California’s Silicon Valley managed the SOFIA program, science, and mission operations in cooperation with the Universities Space Research Association, headquartered in Columbia, Maryland, and the German SOFIA Institute at the University of Stuttgart. The aircraft was maintained and operated by NASA’s Armstrong Flight Research Center Building 703, in Palmdale, California. SOFIA achieved full operational capability in 2014 and concluded its final science flight on Sept. 29, 2022.

About SOFIA

SOFIA was a joint project of NASA and the German Space Agency at DLR. DLR provided the telescope, scheduled aircraft maintenance, and other support for the mission. NASA’s Ames Research Center in California’s Silicon Valley managed the SOFIA program, science, and mission operations in cooperation with the Universities Space Research Association, headquartered in Columbia, Maryland, and the German SOFIA Institute at the University of Stuttgart. The aircraft was maintained and operated by NASA’s Armstrong Flight Research Center Building 703, in Palmdale, California. SOFIA achieved full operational capability in 2014 and concluded its final science flight on Sept. 29, 2022.

About USRA

Founded in 1969, under the auspices of the National Academy of Sciences at the request of the U.S. Government, the Universities Space Research Association (USRA) is a nonprofit corporation chartered to advance space-related science, technology and engineering. USRA operates scientific institutes and facilities, and conducts other major research and educational programs. USRA engages the university community and employs in-house scientific leadership, innovative research and development, and project management expertise. More information about USRA is available at www.usra.edu

More imagery

By Keith Cowing
Source SpaceRef